01 — Active stock
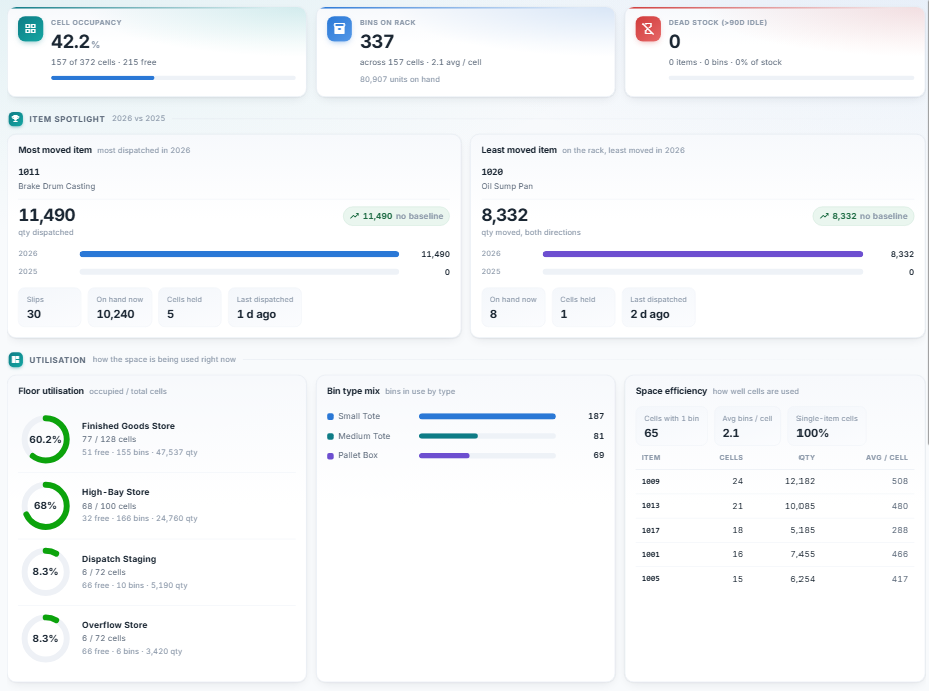
How much of the space is actually working
Occupancy against the cells you own, bins on rack and units on hand, and stock
that has gone dead — on one row. Beneath it, utilisation floor by floor, the mix of
bin types in use, and how efficiently cells are being filled. The item spotlight
names your busiest part and your most stagnant one, with this year against last.
02 — Racks & ageing
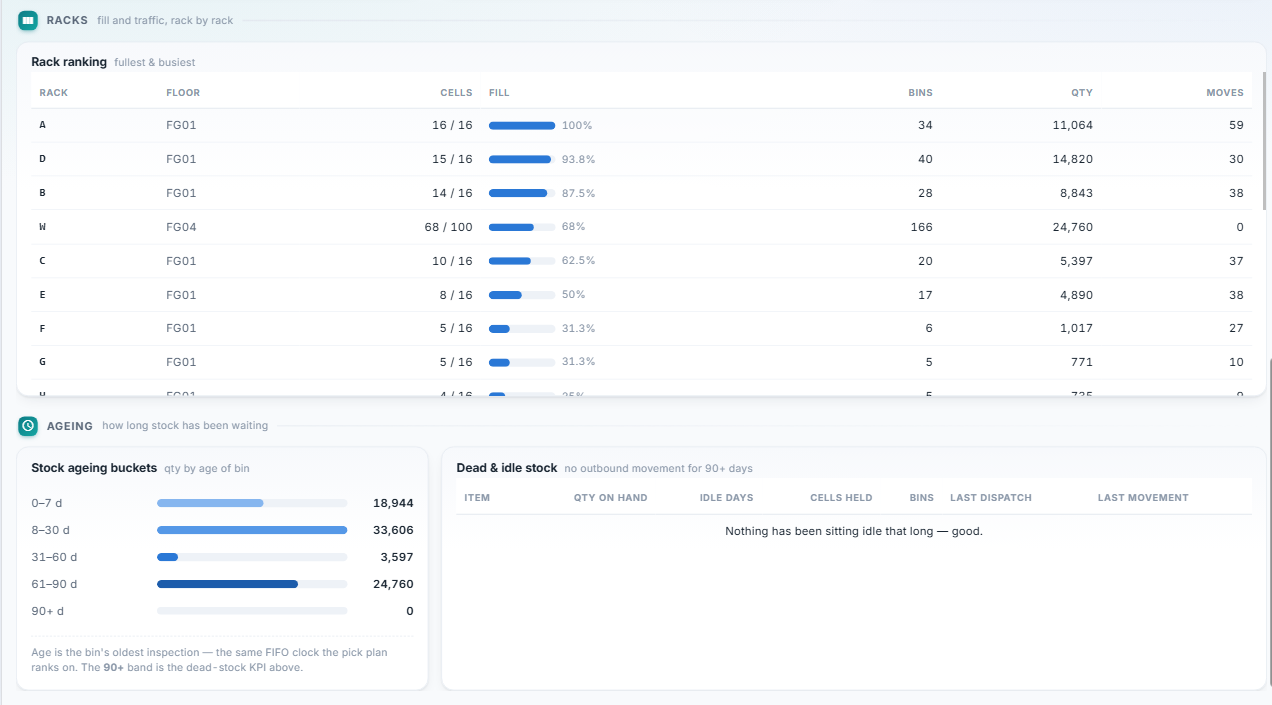
Which racks are full, which are busy, and what has stopped moving
Fill and traffic are not the same thing, so they sit side by side: a rack can be
100% full and barely touched. Below, stock is bucketed by how long it has been
waiting — on the same clock the FIFO pick plan ranks on — and anything past ninety
days is listed by name.
03 — What moved
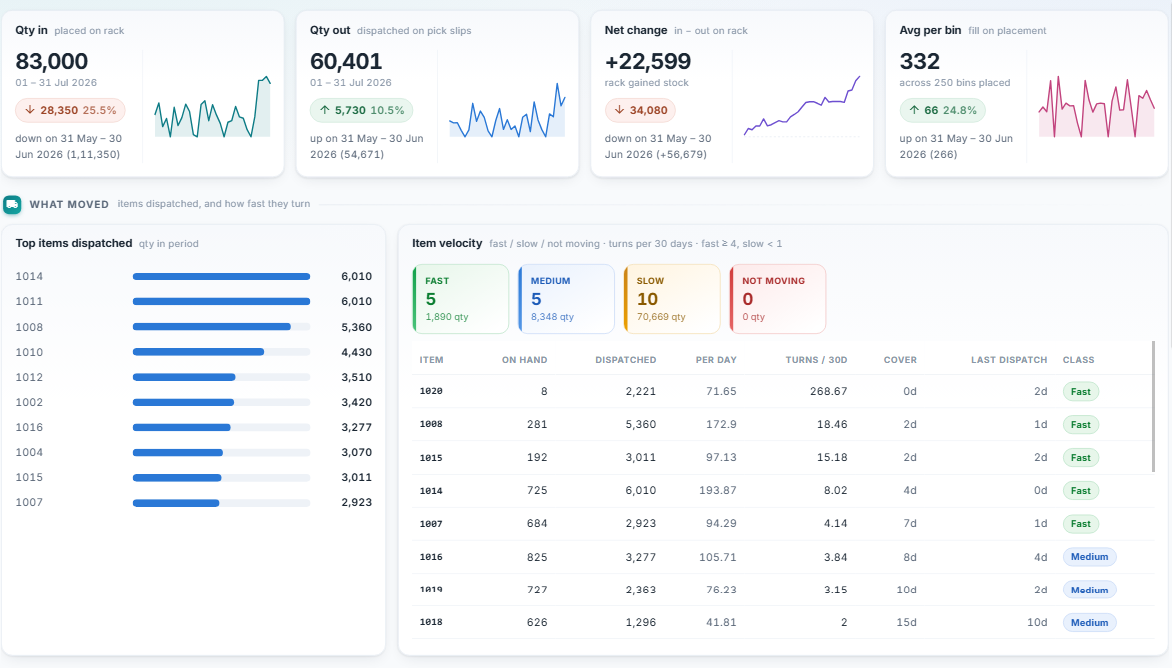
What shipped, and how fast it turns
In, out, and the net change on the rack, each carrying the period before it and the
gap between them. Then the parts that actually shipped, ranked — and every part
classed by how many times its stock turns over in a month, with days of cover
beside it. Fast, medium, slow, or not moving at all.
04 — Movement over time
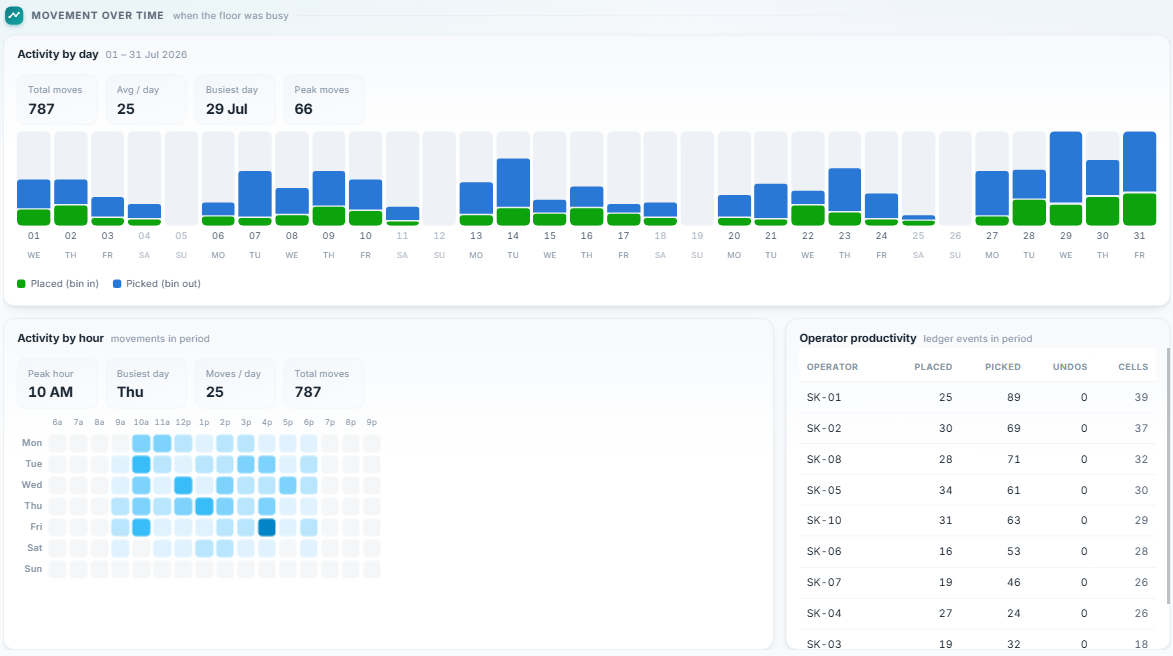
When the floor was busy, and who was on it
Every ledger event by day, split into stock going onto racks and stock coming off,
with the busiest day and the peak called out. Then the same movements as a
day-by-hour heatmap, and a count of placements, picks and undos for each operator
who worked the period.
05 — Spotlight
The three parts worth naming
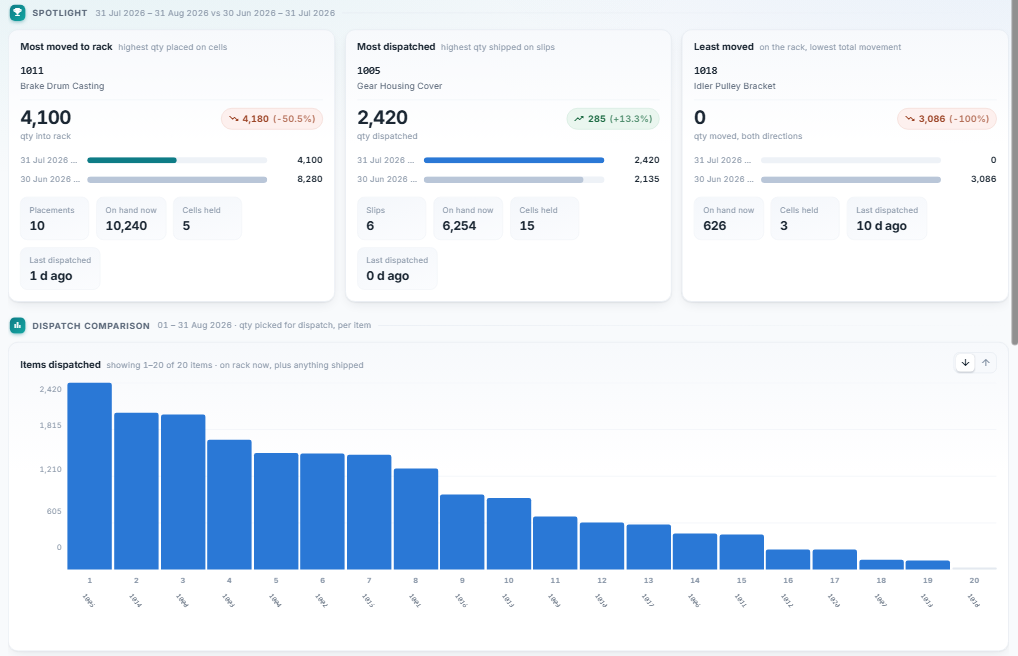
Most moved onto racks, most shipped out, and the one that barely moved at all —
each with its figure against the previous period, the placements or slips behind it,
what is on hand, how many cells it holds and when it last shipped. Underneath, every
part's dispatch on one axis, ranked.
06 — Movers, and the barely touched
Your top five, and the stock nobody went near
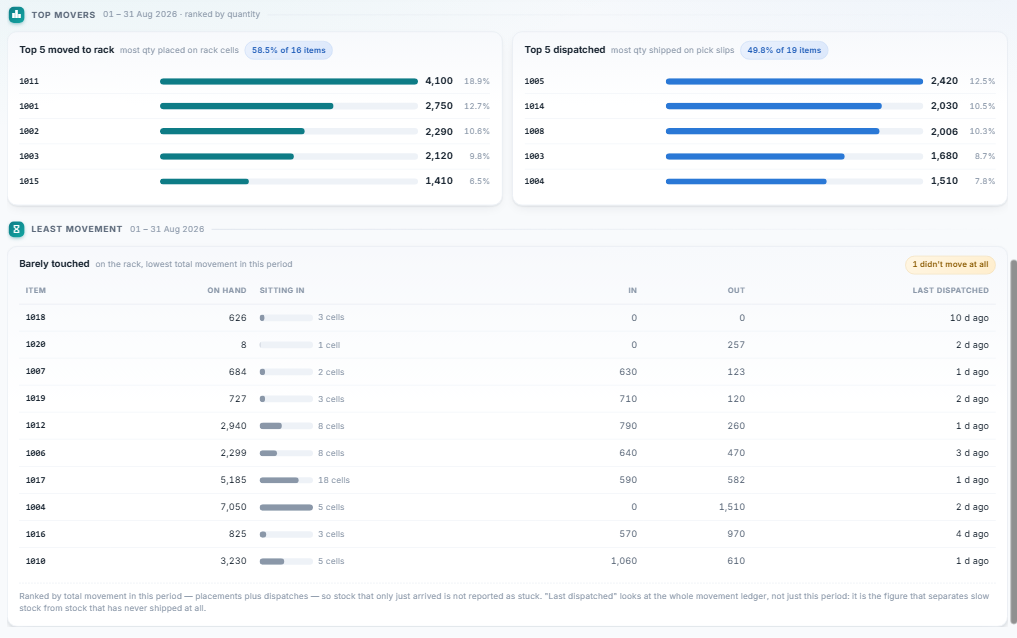
The five parts carrying most of what arrived and most of what left, each with its
share of the total. Then the other end of the list: the least-moved stock, how many
cells it is occupying while it sits, and when it last shipped — with anything that
didn't move at all flagged outright.
07 — All items, in
Every part, ranked by what arrived
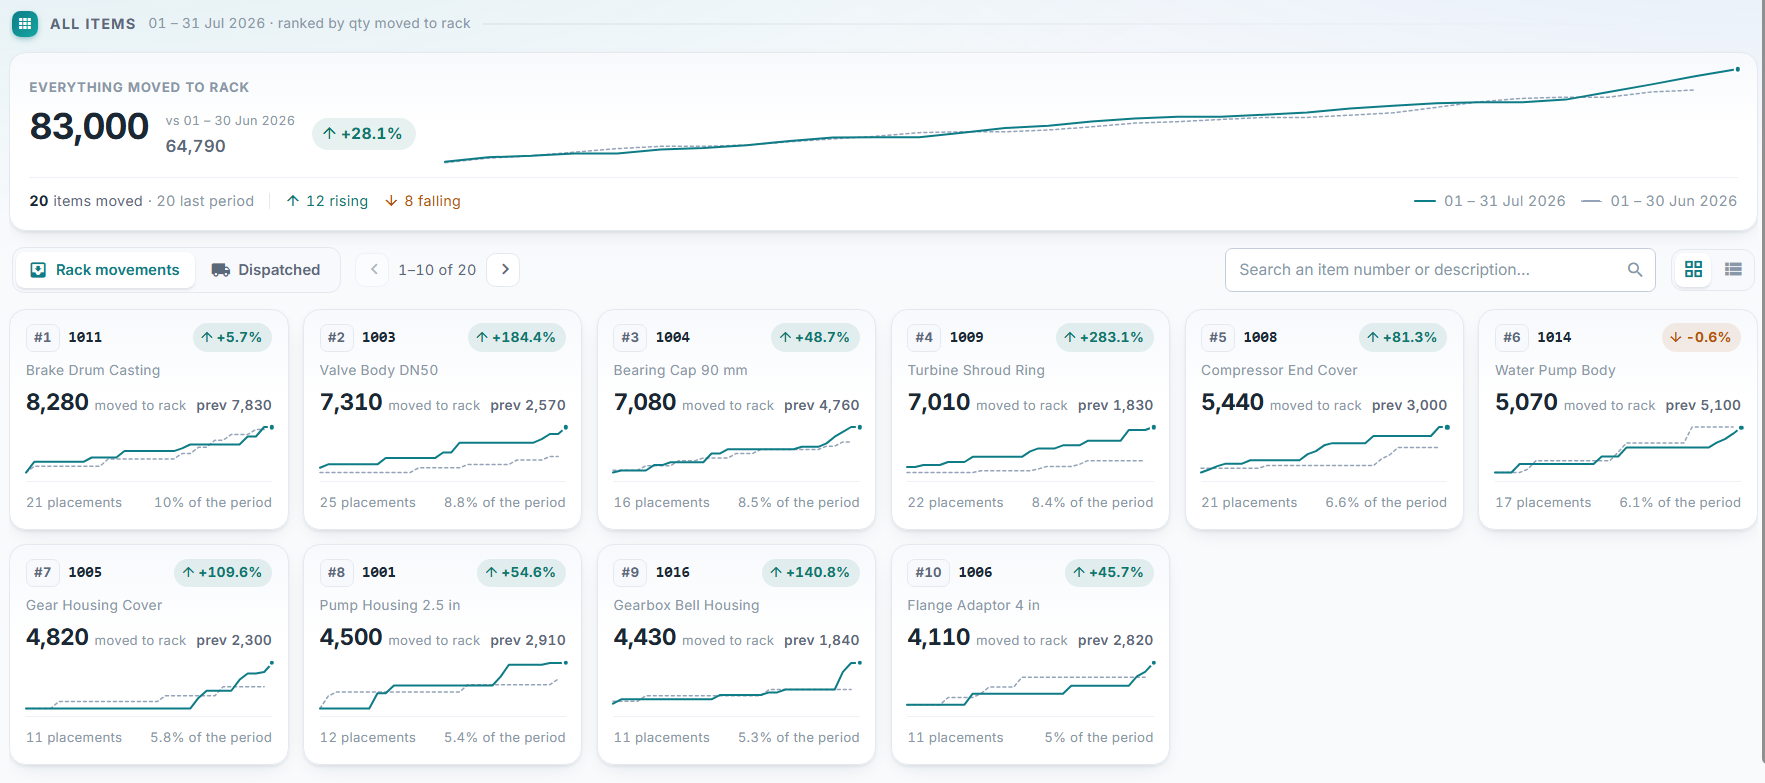
Everything moved onto racks in the period against the period before it, with how
many parts rose and how many fell. Then a card each, ranked: quantity, the previous
figure, a sparkline holding both periods, the number of placements it took and the
share of the period that part accounts for.
08 — All items, out
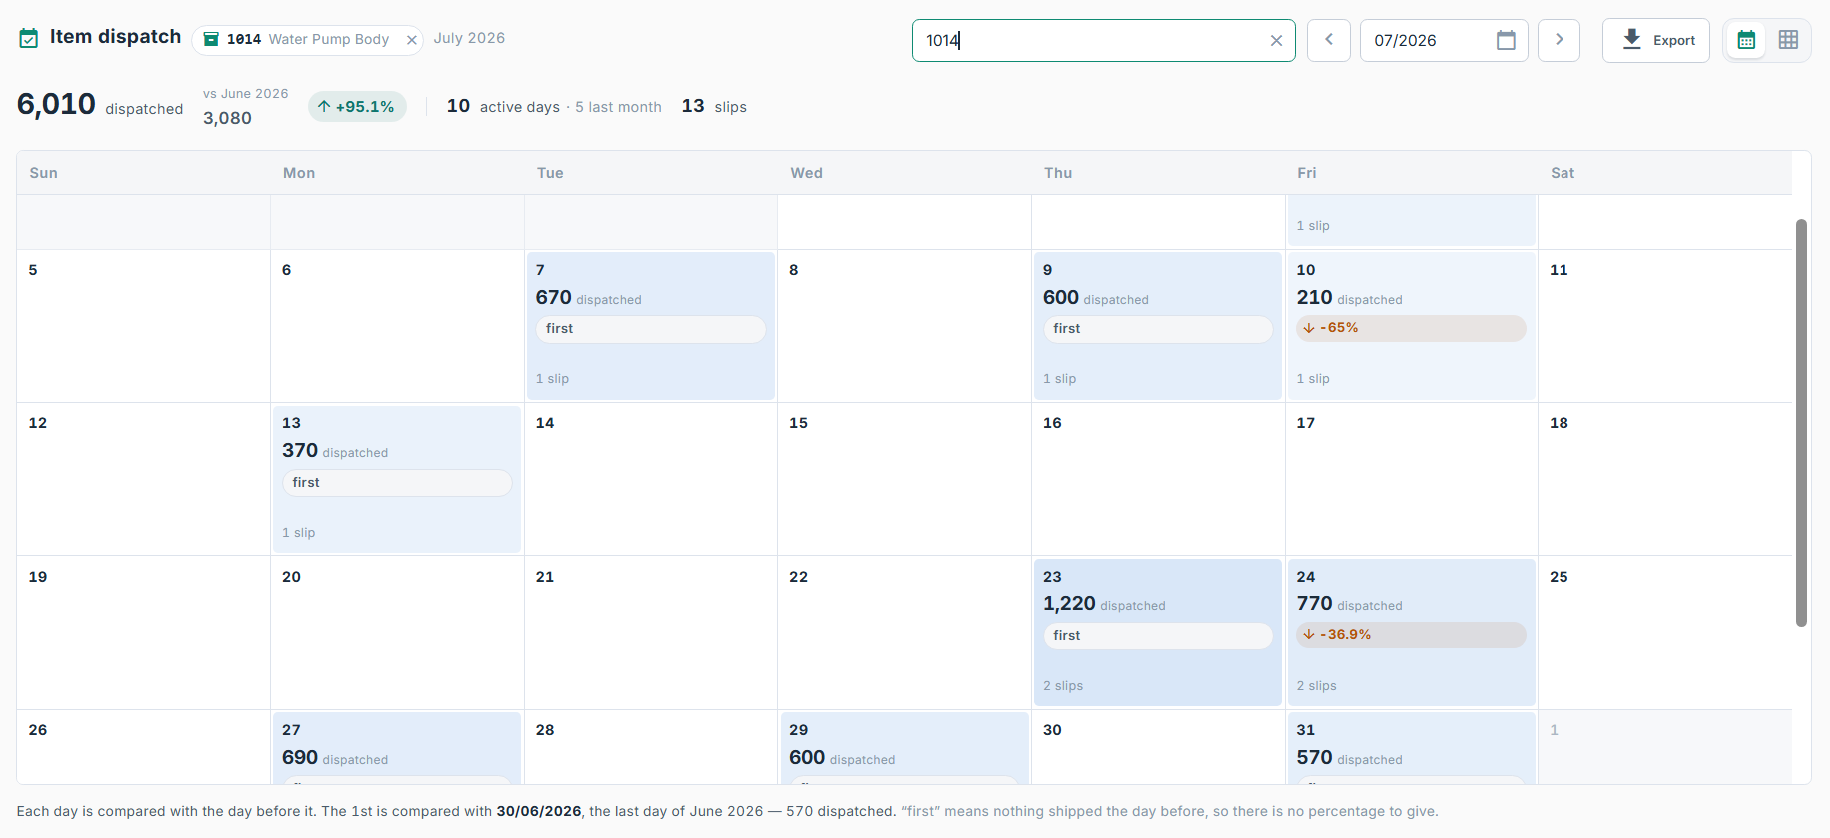
One tab away, the same board for what left
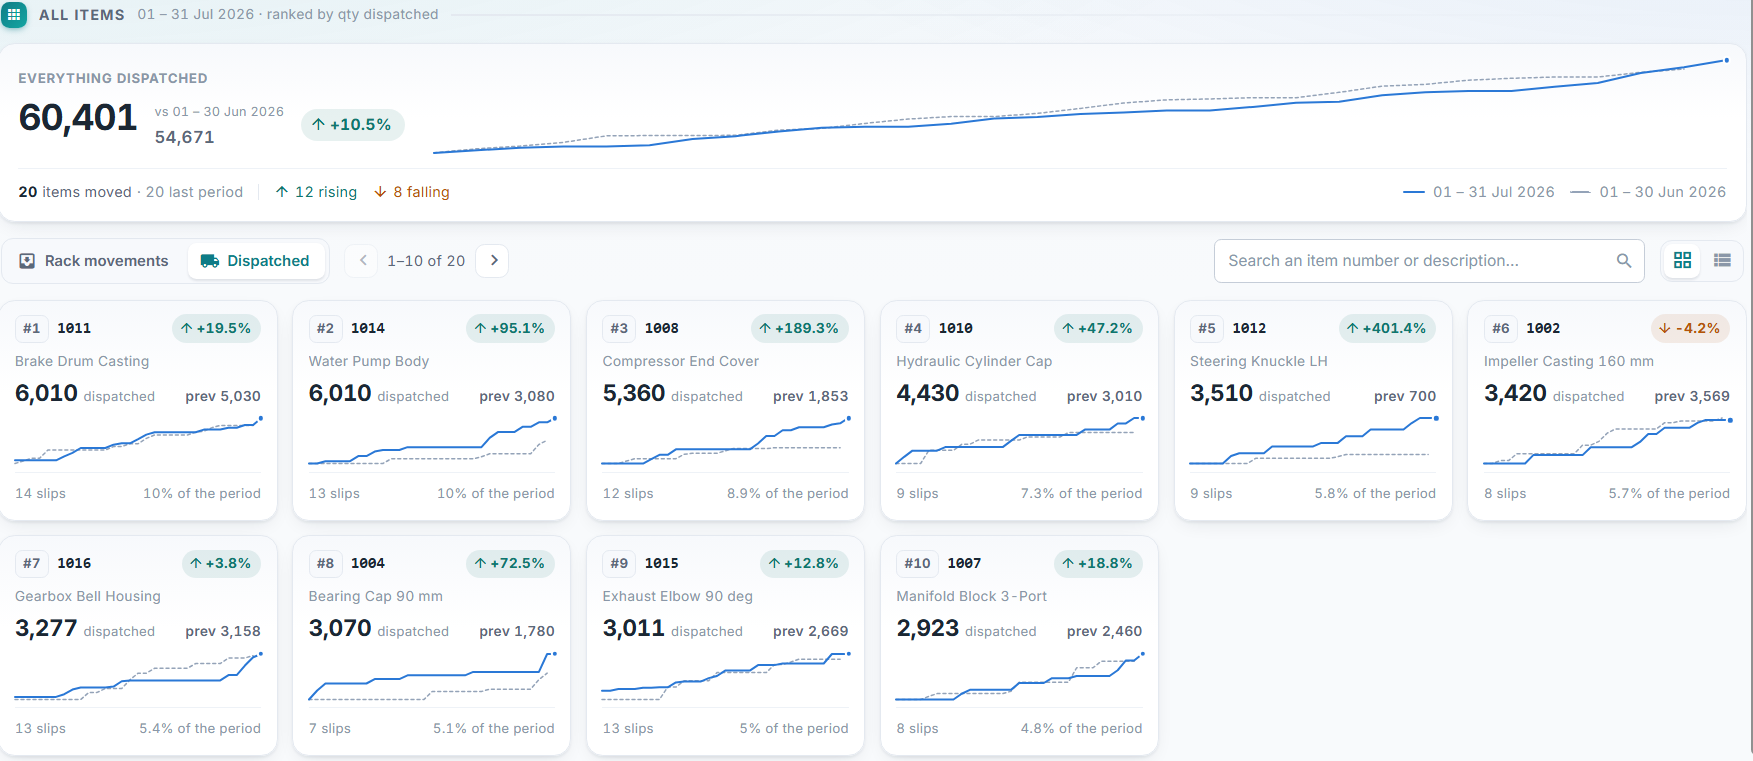
Switching to Dispatched swings the whole board — the headline, the ranking, every
card and every sparkline — from stock arriving to stock shipping, and the placement
count becomes a slip count. Search narrows it to one part; the toggle trades cards
for a list.
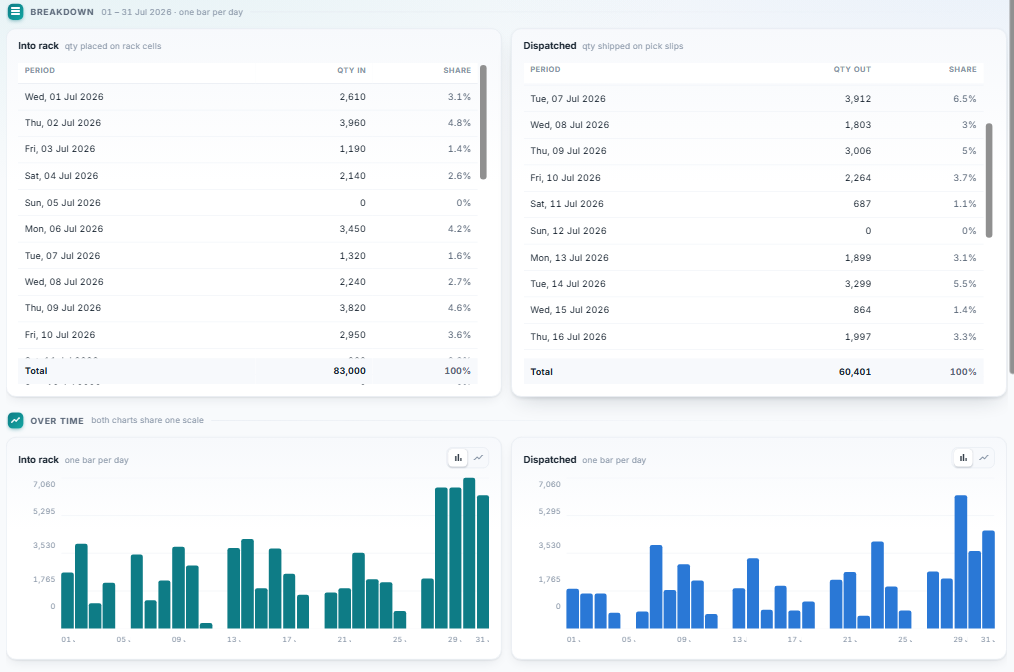
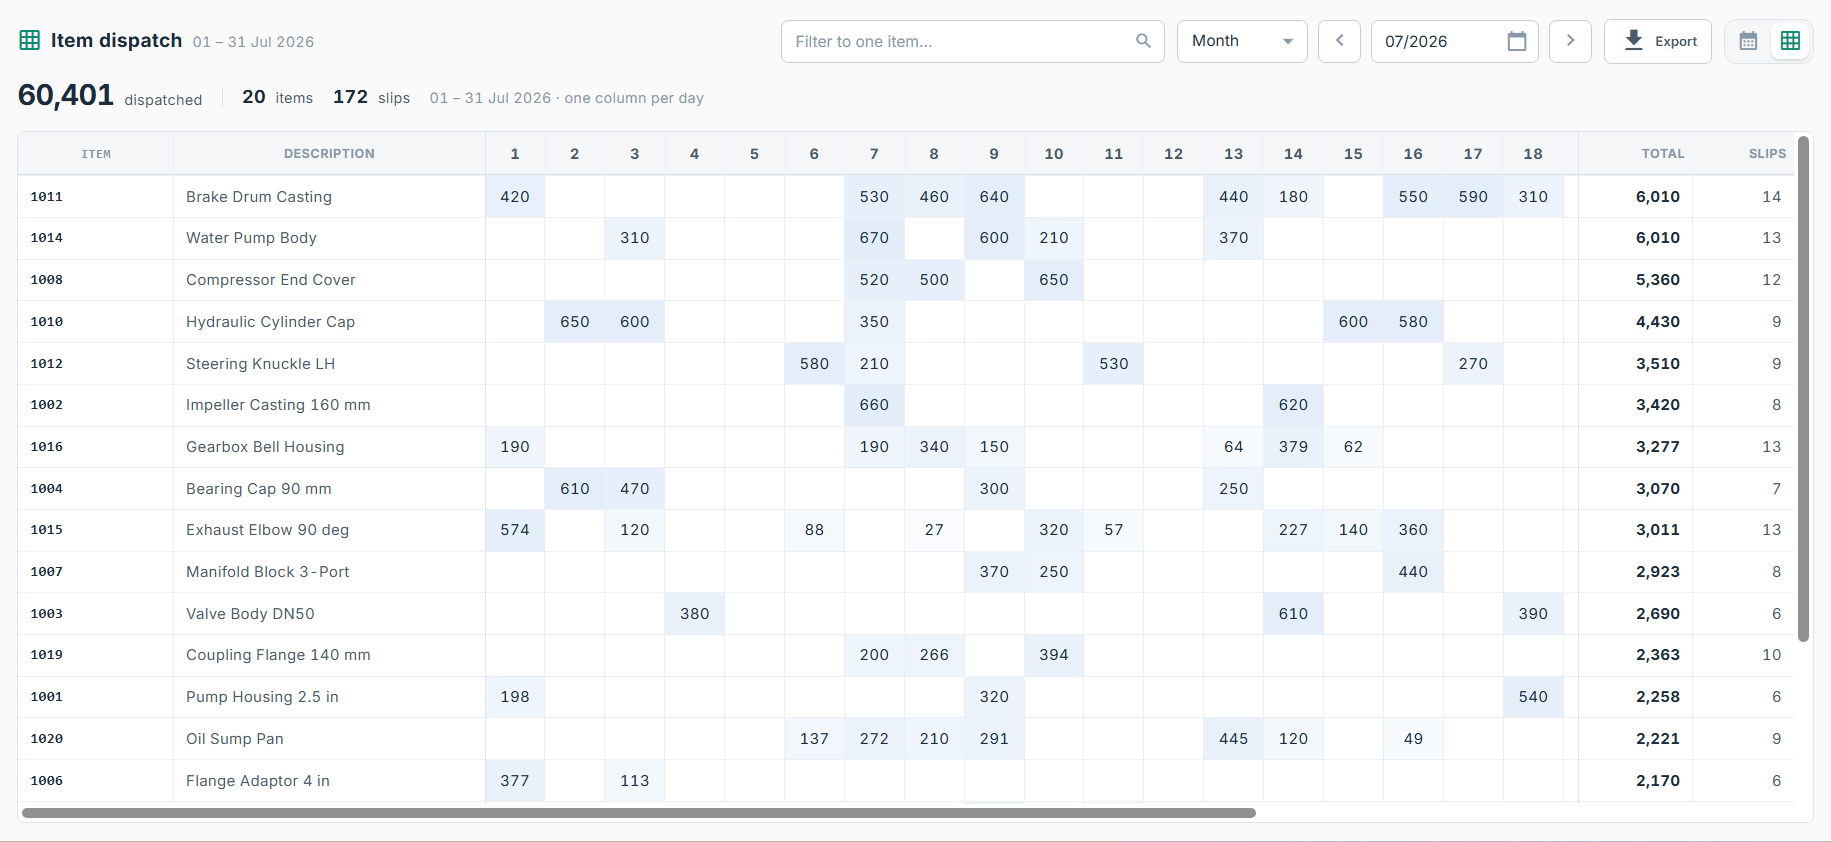
09 — Day by day
In and out, on a shared scale
Every day of the period with its quantity and its share of the total, for stock
arriving and stock leaving. Below, the same two series as charts that share one
scale on purpose — which is what makes it obvious at a glance whether the rack
gained that week or gave it back.
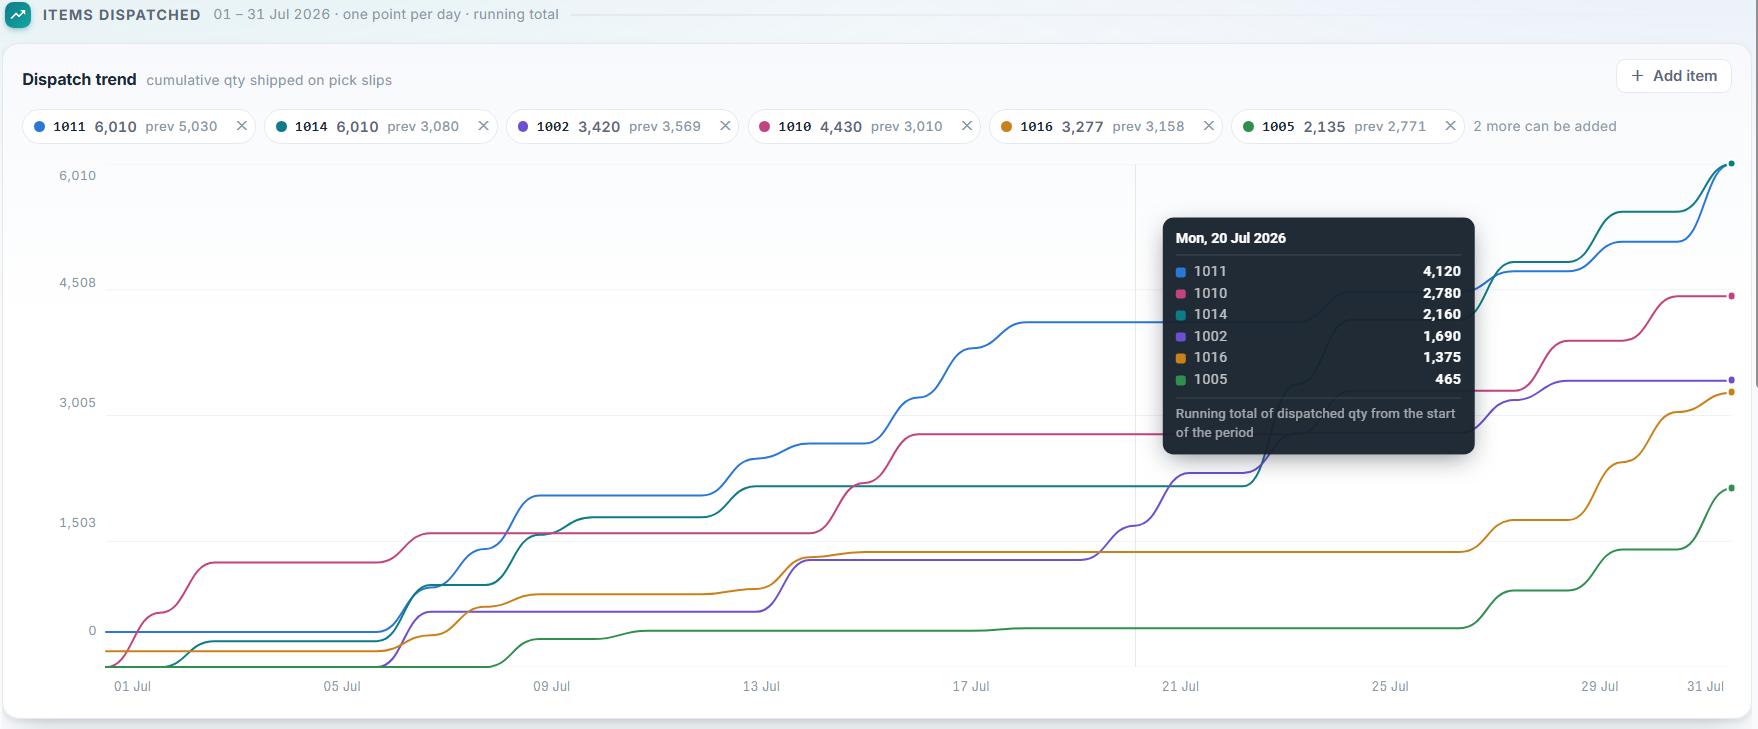
10 — Dispatch trend
Several parts on one axis
Pin the parts you care about and watch their running totals race each other across
the period. Hovering a day reads every line at once, so a part that stalled while
another ran is obvious rather than something you have to go looking for.
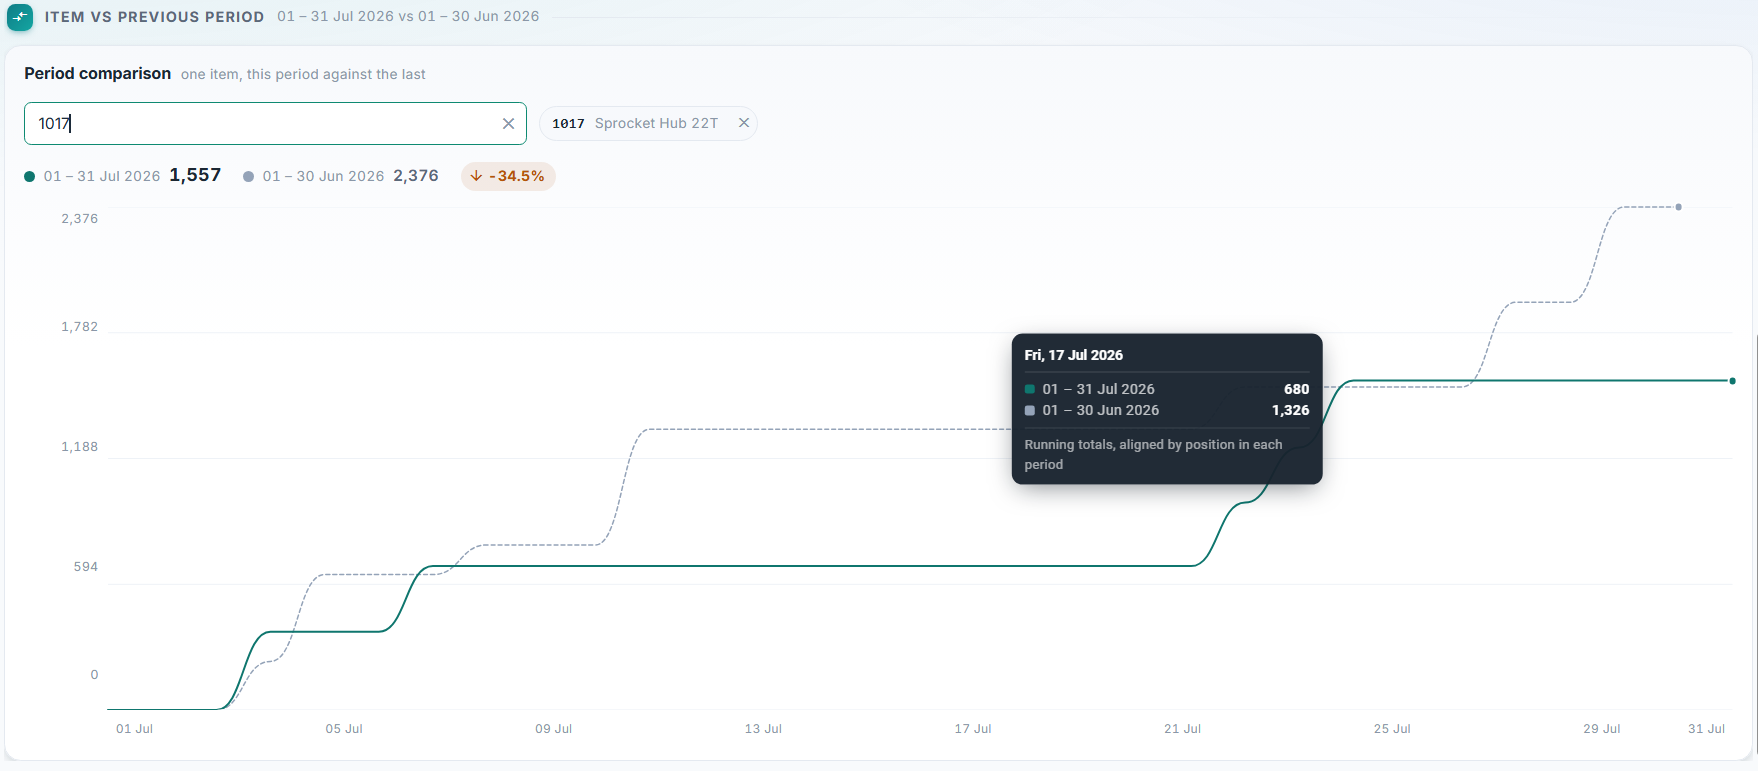
11 — Period comparison
One part, against its own last period
The current period drawn over the one before it, aligned by position rather
than by date — so a 31-day month and a 30-day month still compare honestly.
The tooltip reads both lines on the same day of each.